
雅思A类小作文话题
年龄群体
Age groups
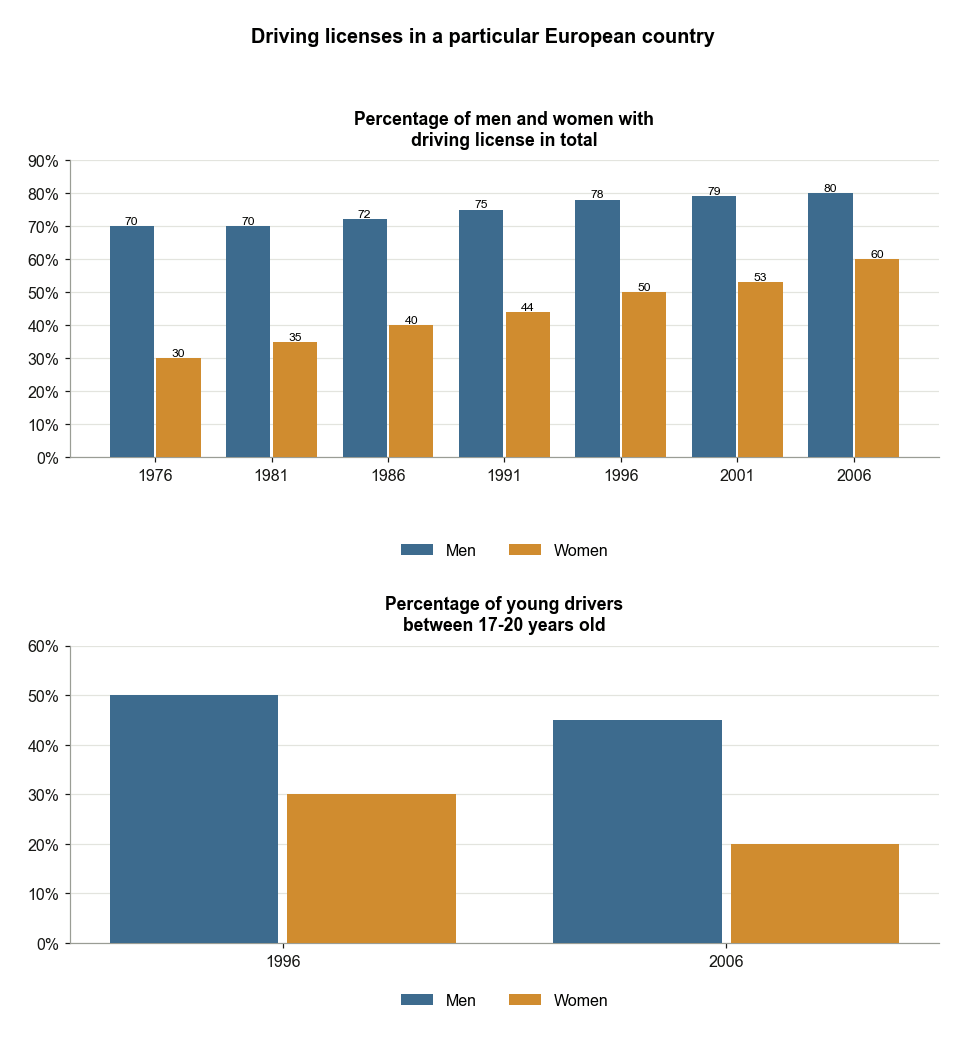
欧洲某国男女驾照持有比例
Driving Licenses by Gender in a European CountryThe bar charts below show information (the percentage of males and females with driving licenses in total; the percentage of young drivers between 17 and 20 years old) about driving licenses in a particular European country. Summarise the information by selecting and reporting the main features, and make comparisons where relevant.
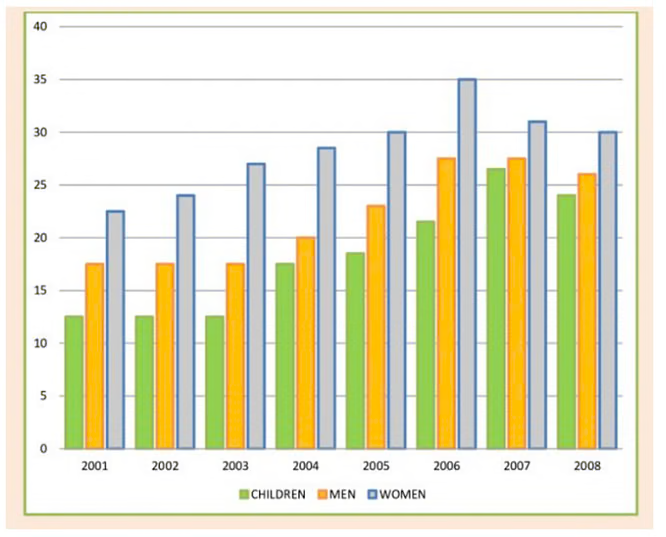
英国2001至2008年每日果蔬摄入量
UK Daily Fruit and Vegetable Consumption 2001-2008The chart below shows the percentage of people who ate five portions of fruits and vegetables per day in the UK from 2001 to 2008.
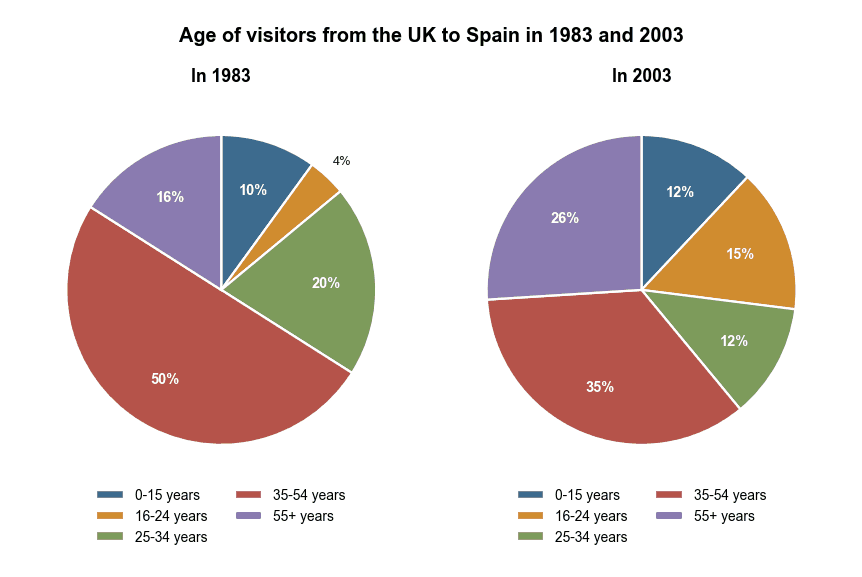
1983年与2003年英国赴西班牙游客年龄
Age of UK Visitors to Spain, 1983 and 2003The charts below give information about the age of visitors from the UK to Spain in 1983 and in 2003. Summarise the information by selecting and reporting the main features, and make comparisons where relevant.
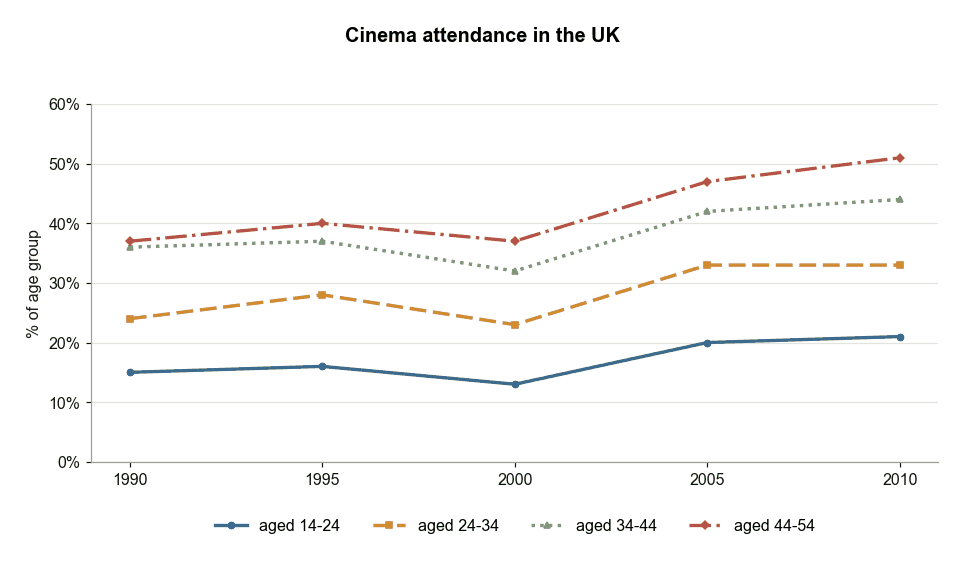
英国各年龄段的影院观影情况
Cinema Attendance by Age Group in the UKThe line graph below gives information on cinema attendance in the UK. Summarise the information by selecting and reporting the main features, and make comparisons where relevant.
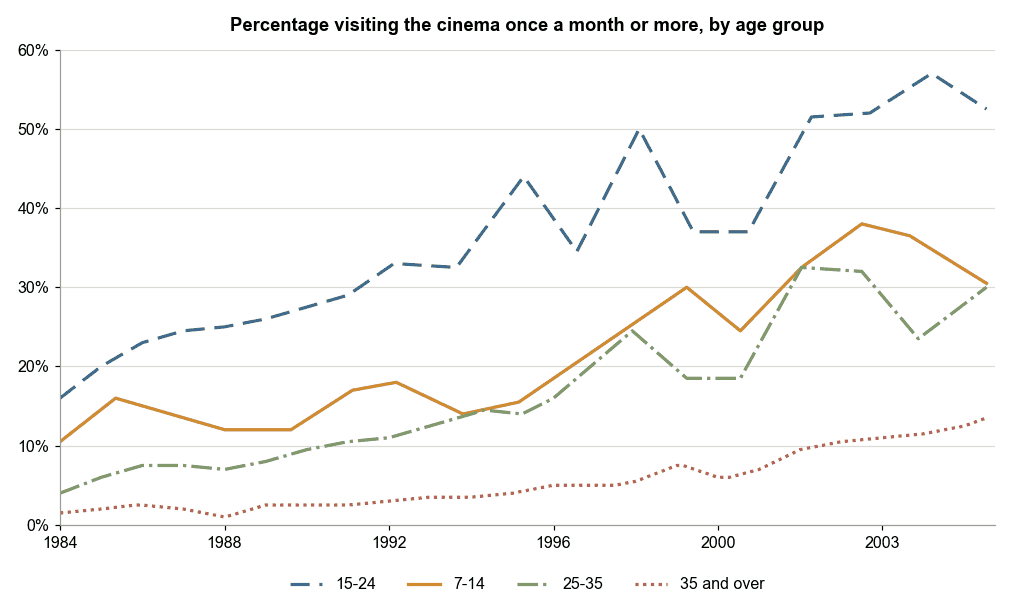
1984年至2003年各年龄段每月看电影的比例
Monthly Cinema Attendance by Age Group (1984–2003)The graph shows the percentage of visiting the cinema once a month or more between 1984 to 2003 (4 age groups). Summarise the information by selecting and reporting the main features, and make comparisons where relevant.
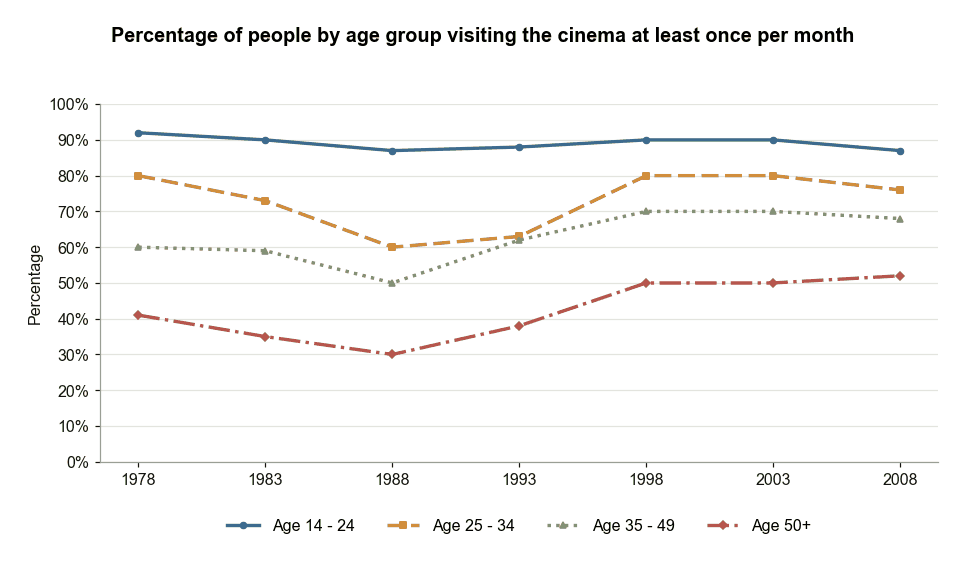
1978年至2008年各年龄组每月看电影的比例
Monthly Cinema Attendance by Age Group (1978–2008)The graph below shows the percentage of people by age group visiting the cinema at least once per month in one particular country between 1978 and 2008. Summarise the information by selecting and reporting the main features, and make comparisons where relevant.
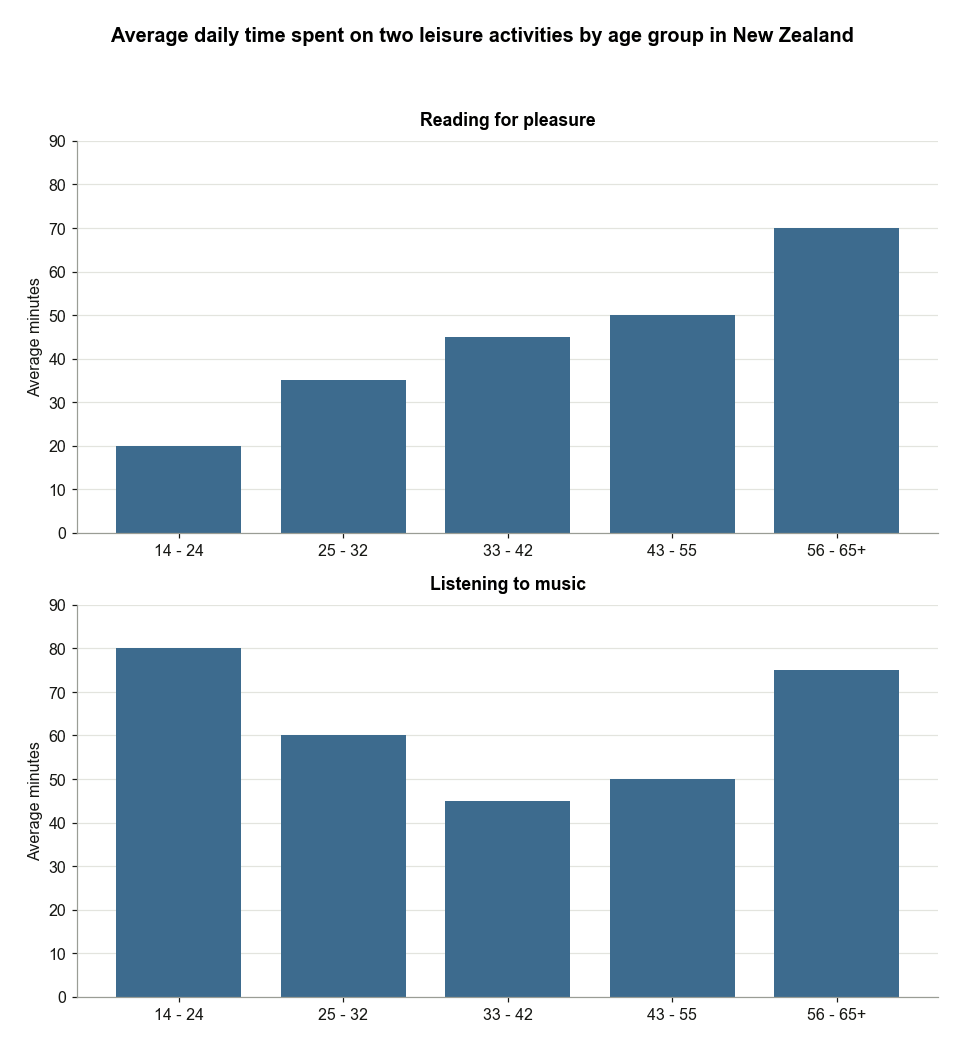
新西兰各年龄组每日休闲时间
Daily Leisure Time by Age in New ZealandThe charts give information about the average amount of time per day spent on two common leisure activities of different age groups in New Zealand. Summarise the information by selecting and reporting the main features, and make comparisons where relevant.
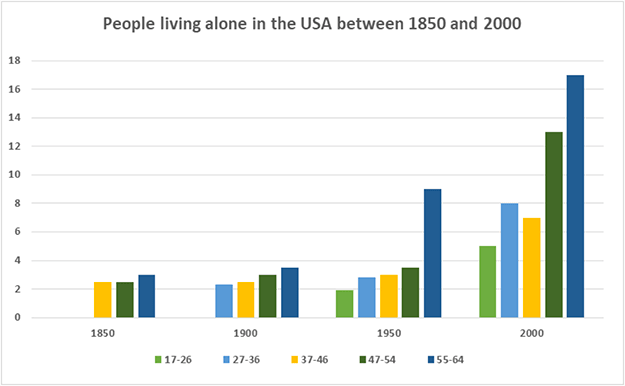
美国各年龄段独居人口的比例
US Living Alone Percentages by Age GroupThe bar chart below shows the percentage of people living alone in five different age groups in the USA between 1850 and 2000. Summarise the information by selecting and reporting the main features, and make comparisons where relevant.
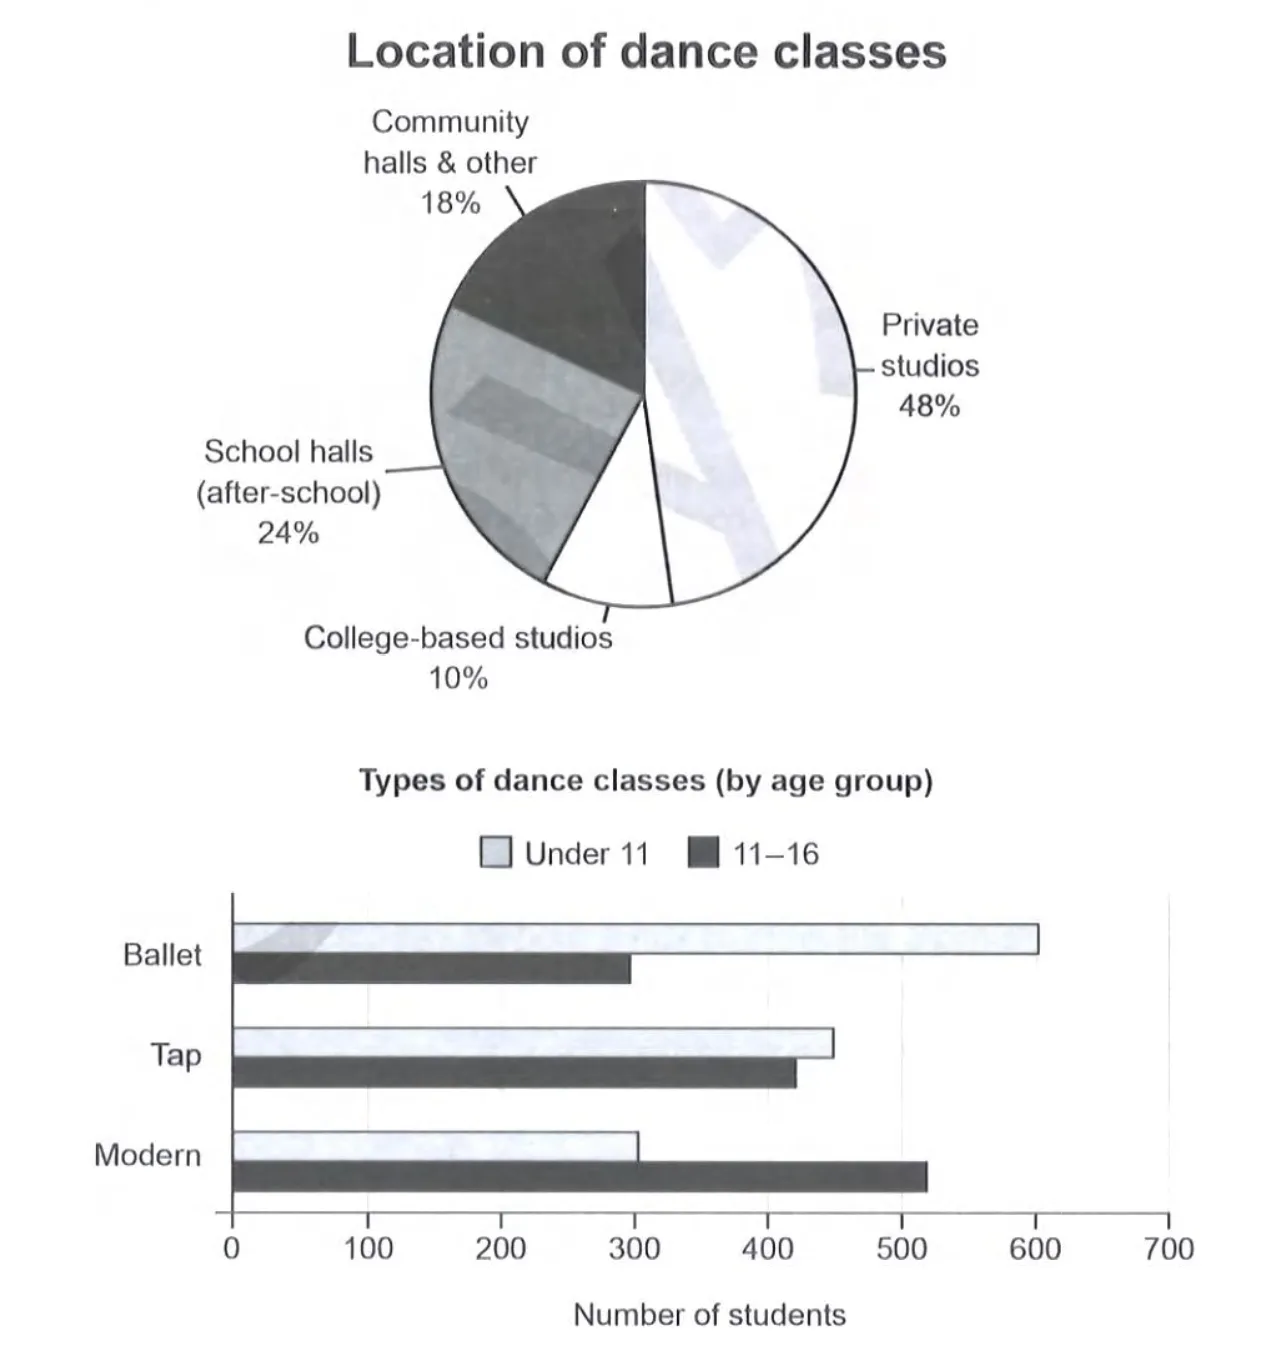
澳大利亚某镇舞蹈班的地点和类型
Location and Types of Dance Classes in AustraliaThe charts below give information on the location and types of dance classes young people in a town in Australia are currently attending. Summarise the information by selecting and reporting the main features, and make comparisons where relevant.
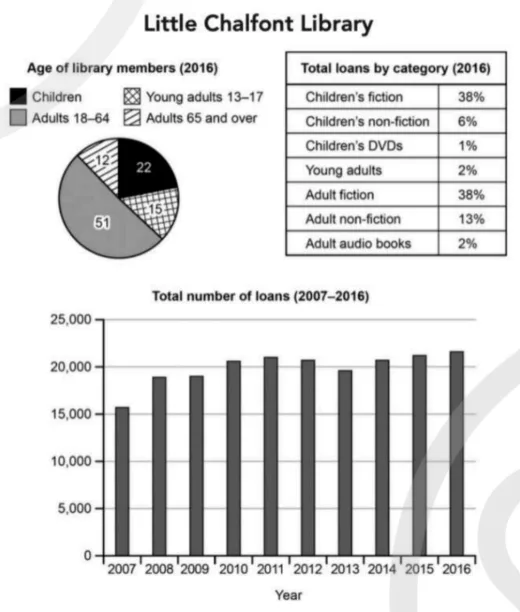
Little Chalfont 图书馆会员与借阅
Little Chalfont Library Membership and LoansThe charts below give information about a public library in a town called Little Chalfont. Summarise the information by selecting and reporting the main features, and make comparisons where relevant.
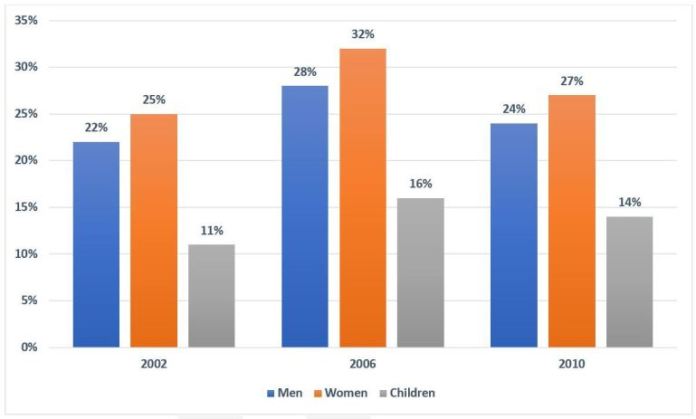
英国居民水果和蔬菜摄入达标率
UK Fruit and Vegetable Consumption RatesThe chart below shows the percentage of the population in the UK who consumed the recommended daily amount of fruits and vegetables in 2002, 2006 and 2010.