University Library Users and Satisfaction Survey

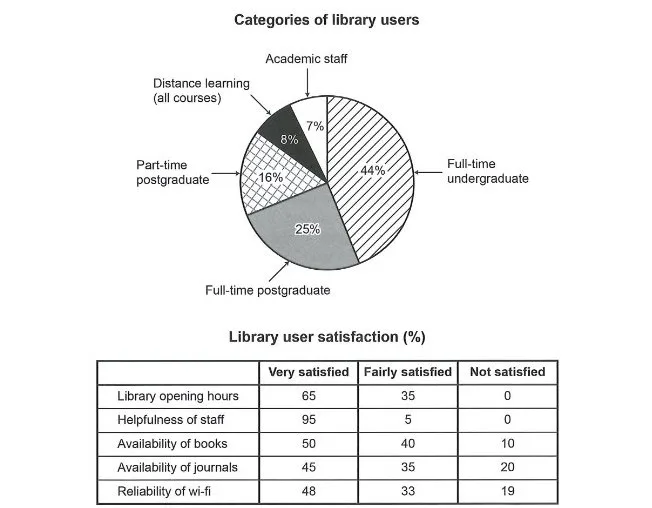
The chart and table below show the results of a survey of library users at a university. Summarise the information by selecting and reporting the main features, and make comparisons where relevant.

Cambridge IELTS 21 Academic Test 4 Writing Task 1 visual

Annotated response

8 correction notes

Showing 8 correction notes.

The illustrate the categories of library users and their levels of satisfaction with a variety of services, including opening hours, staff helpfulness, the availability of books and journals, and the reliability of the Wi-Fi connection.

Overall, full-time undergraduates constitute the , while academic staff members represent the smallest user group. Regarding customer satisfaction, staff helpfulness receives the most positive feedback, whereas the availability of journals and Wi-Fi reliability register the lowest satisfaction rates.

, full-time postgraduates account for 25%, followed by part-time postgraduates (16%) and distance learners (8%). The academic staff make up only 7% of users, less than one-sixth the number of undergraduates using library services.

In terms of user satisfaction, the figures for staff helpfulness are significantly higher than those for other services, with the of . In contrast, journal availability receives the least positive response from survey participants, as only 45% are very satisfied, . Wi-fi reliability at 19%, despite nearly half (48%) being very satisfied. Library opening hours and book availability , with 65% and 50% of users feeling highly satisfied with the services, respectively.

Overall assessment

Why this response received Band 8.0

The strongest aspect is the accurate, well-organised selection of data, with a clear overview and correct figures for both the pie chart and the table. The main limitation is a small data gap, since the largest user group is never given its actual percentage, and a few comparisons could be made more explicit.

IELTS criteria

How each score was decided

Task Achievement

8.0

The response covers all user categories and all five services with a clear overview and accurate data, though the percentage for full-time undergraduates is omitted.

Coherence and Cohesion

8.0

Information is logically sequenced from overview to chart details to table details, with effective use of cohesive devices such as 'Overall', 'In contrast' and 'In terms of'.

Lexical Resource

8.0

Vocabulary is flexible and precise, with natural phrasing such as 'constitute the largest proportion', 'register the lowest satisfaction rates' and 'receives the least positive response'.

Grammatical Range and Accuracy

8.0

A wide range of complex structures, including relative and concessive clauses, is used accurately with only rare minor slips.

Keep practising this question