
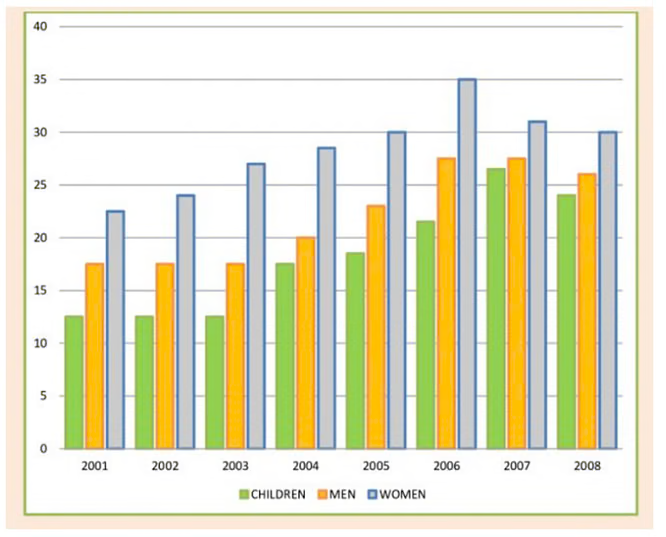
The given graph shows the proportion of the UK population following the dietary recommendation of consuming fruit and vegetables from 2001 to 2008.
Overall, there was an increase observed across the UK during the mentioned period, with a notable gap in the growth rates among children, men, and women.
Initially, the percentage of children meeting the dietary guideline stood at approximately 12% in 2001, maintaining a steady state until 2003 before experiencing a consistent rise, in 2007. Similarly, the proportion of men was roughly at 17% in the year 2001, showing in the next two years. Then, the by 2007.
On the other hand, the percentage of women of fruits and vegetables a day in 2001 was the highest among the said categories. Over the period from 2001 to 2006, there was a gradual increase in , , and experiencing a in the final two years. women remained as the highest population in 2008 compared to men and children.