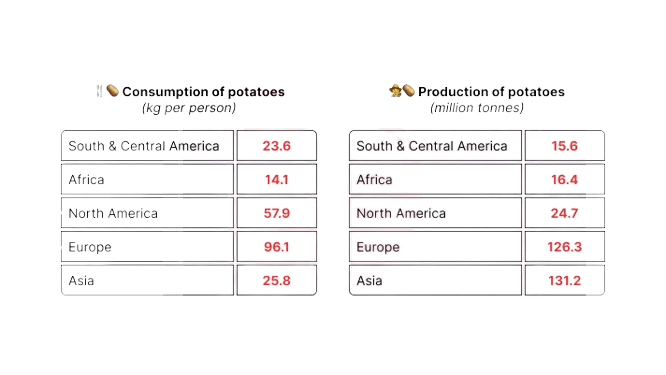
Potato Consumption and Production by Region in 2006

The tables below provide information about the consumption and production of potatoes in five parts of the world in 2006.

IELTS Academic Writing Task 1 question image

Annotated response

5 correction notes

Showing 5 correction notes.

The tables present data on potato consumption and production across various regions of the world in 2006.

Overall, Europe had the highest per capita consumption of potatoes, although its production was slightly lower than that of emerged as the top producer. In contrast, South and Central America, along with Africa, recorded the lowest levels of both consumption and production.

In terms of potato consumption, Europe led in 2006, with an average consumption of 96.1 kilograms per capita (kg/capita). North America followed, with a figure of 57.9 kg/capita, which was almost twice the consumption level of both the Asia/Oceania region and South and Central America, each of which consumed around 25 kg/capita. Africa had the lowest consumption rate, with only 14.1 kg/capita.

Regarding production, the largest producer, with a total output of 131.2 million tonnes (Mt). Although Europe consumed the most potatoes, it ranked second in production, generating 126.3 Mt. In contrast, North America, Africa, and South and Central America had the lowest production levels, with figures ranging between 15 and 25 Mt each.

In summary, while Europe stood out as the highest consumer of potatoes, other regions in production. Africa and South and Central America exhibited the lowest figures in both

Overall assessment

Why this response received Band 7.5

The report covers the main patterns and uses controlled, varied language, but its repeated expansion of Asia to include Oceania changes the table’s regional scope. The almost twice comparison is also inaccurate. In addition, the final summary repeats information from the overview and a stray character remains at the end.

IELTS criteria

How each score was decided

Task Achievement

7.0

The response covers both tables and the main regional patterns, but repeatedly adds Oceania to the region labelled Asia. It also says North America’s consumption is almost twice the Asian and South/Central American figures, although 57.9 is more than twice both 25.8 and 23.6. These are substantive reporting inaccuracies.

Coherence and Cohesion

7.5

The overview and separate consumption and production paragraphs give a clear structure. However, the final summary largely repeats the overview, adding length without a new comparison or useful clarification.

Lexical Resource

7.0

Vocabulary is flexible and precise for describing data (e.g., 'per capita consumption', 'emerged as the top producer', 'surpassed'), with only a stray typographical error at the end.

Grammatical Range and Accuracy

8.0

A wide range of structures is used accurately, including complex comparative clauses and participle constructions, with errors rare and non-impeding.