
老题 · 2026更多近期考题
1981年至2000年某欧洲国家的燃料产量
Fuel Production in a European Country 1981–2000
The graph below shows the production levels of main fuels in a European country from 1981 to 2000.
Summarise the information by selecting and reporting the main features, and make comparisons where relevant.
下图显示了1981年至2000年某欧洲国家主要燃料的产量水平。
请选择并报告主要特征来概括信息,并在相关之处进行比较。
1 篇范文估分 7.0,换你来写?
先自己写,再往下看范文和批改,差距一眼就能看出来。
- 题目和图表已放好
- 按考试计时 20 分钟
- 约 20 秒出结果
- 每周免费预览 1 次
来自本题范文
要点:1981年至2000年某欧洲国家的燃料产量
为什么这是折线图 ,要求你描述随时间变化的主要趋势和变化。
所以我们把要点分为概述(整个时期的主要趋势)和要点(值得描述的数据和对比)。
要点
6个要点Coal production, meanwhile, plummeted to 50 tonnes in 1985 after a first few years of stability.
在范文中定位 The volume of natural gas was virtually unchanged until 1990.
在范文中定位 Meanwhile, the production level of natural gas soared from 1997 onwards, finally peaking at 80 tonnes.
在范文中定位 After 1990, petroleum production rose again to achieve the highest point of 135 tonnes in 1996.
在范文中定位 The volume of coal manufactured continued declining until hitting an all-time low of 40 tonnes in 2000, making it the smallest figure at the end of the 20-year period.
在范文中定位 This was two-thirds the data of petroleum and twice that of coal.
在范文中定位
同一道题 · 不同范文
范文与批改
范文 01
必改建议
作文 · 220词 · 3段 · 12条批注
来自本题范文
实用词汇:1981年至2000年某欧洲国家的燃料产量
natural gas
- 释义
- 天然气:在地下发现、用作燃料的气体。Gas found underground that is used as fuel.
The volume of natural gas was virtually unchanged until 1990.
估算分数 7.0在范文中定位
练习这道题
写下你的作文
已加载题目:A类小作文。
第1部分
建议用时约 20 分钟,至少写 150 词。
词数:020:00 输入第一个词后开始计时
相关题目
更多折线图题目
折线图
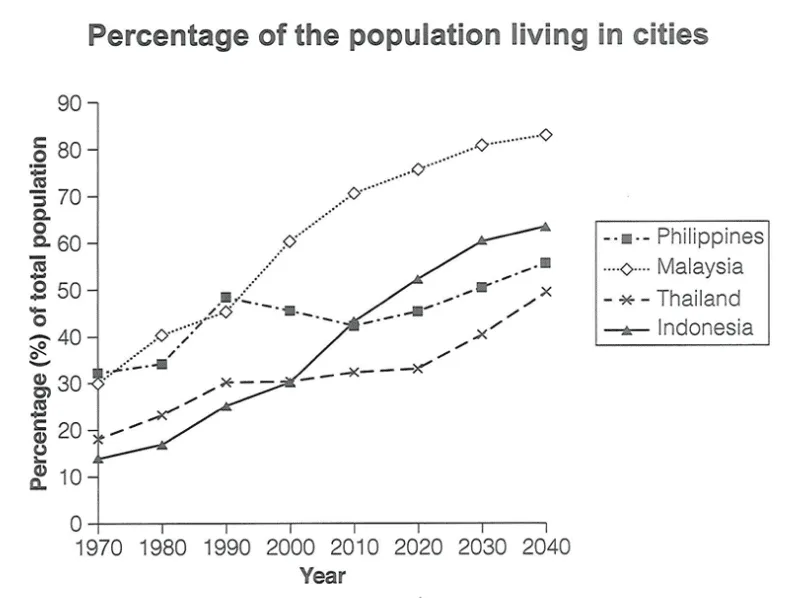
四个亚洲国家1970至2040年城市人口比例
Urban Population Percentage in Four Asian Countries 1970-2040The graph below gives information about the percentage of the population in four Asian countries living in cities from 1970 to 2020, with predictions for 2030 and 2040. Summarise the information by selecting and reporting the main features, and make comparisons where relevant.
折线图
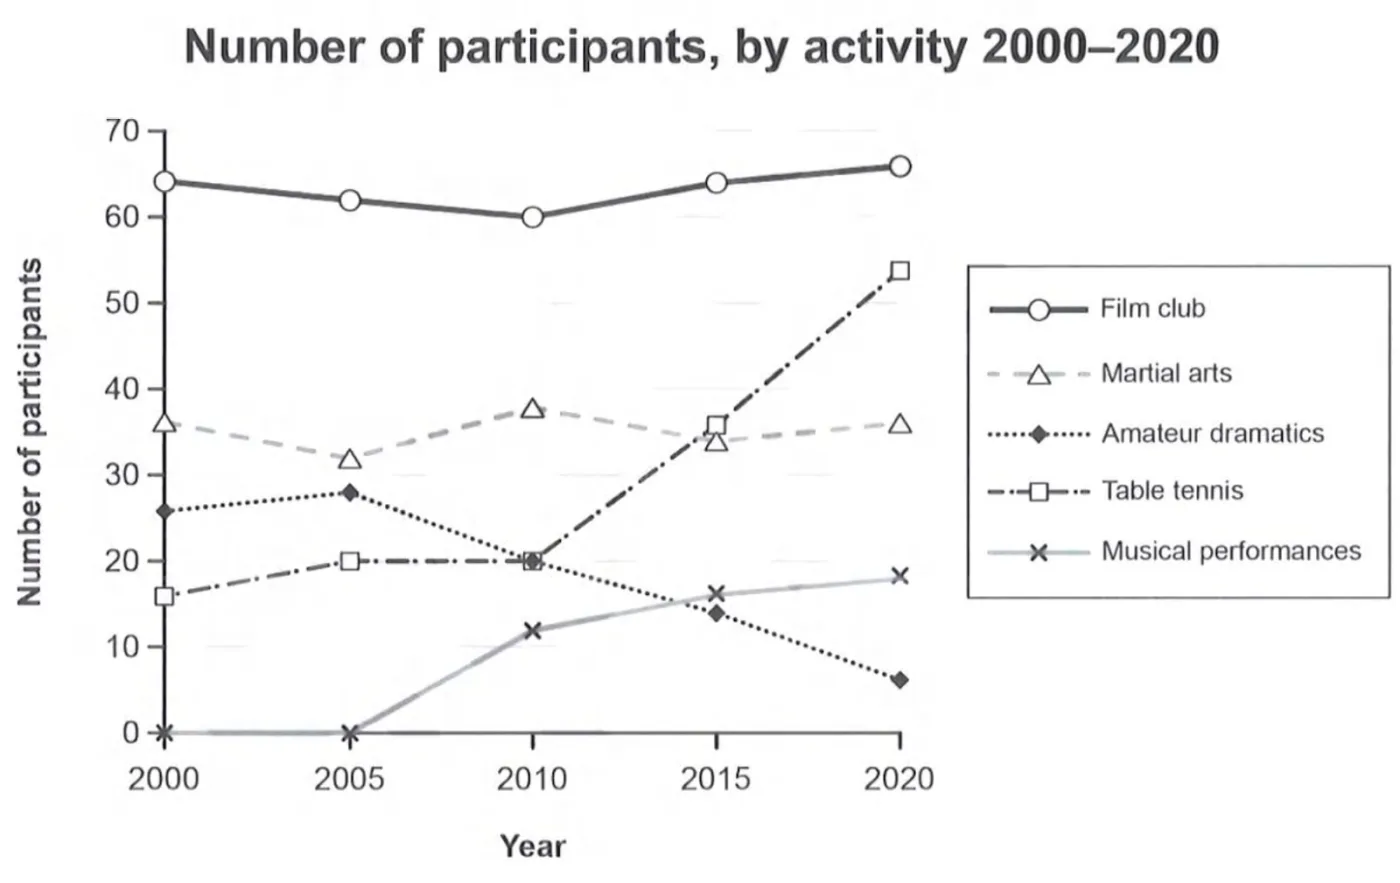
墨尔本社区中心活动参与人数(2000–2020)
Participants in Melbourne Social Centre Activities (2000–2020)The graph below gives information on the numbers of participants for different activities at one social centre in Melbourne, Australia for the period 2000 to 2020. Summarise the information by selecting and reporting the main features, and make comparisons where relevant.
折线图
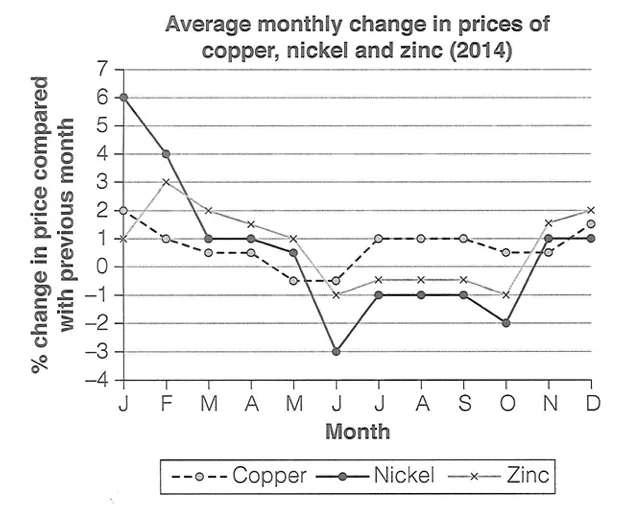
2014年三种金属的月度价格变化
Monthly Price Changes of Three Metals in 2014The graph below shows the average monthly change in the prices of three metals during 2014. Summarise the information by selecting and reporting the main features, and make comparisons where relevant.