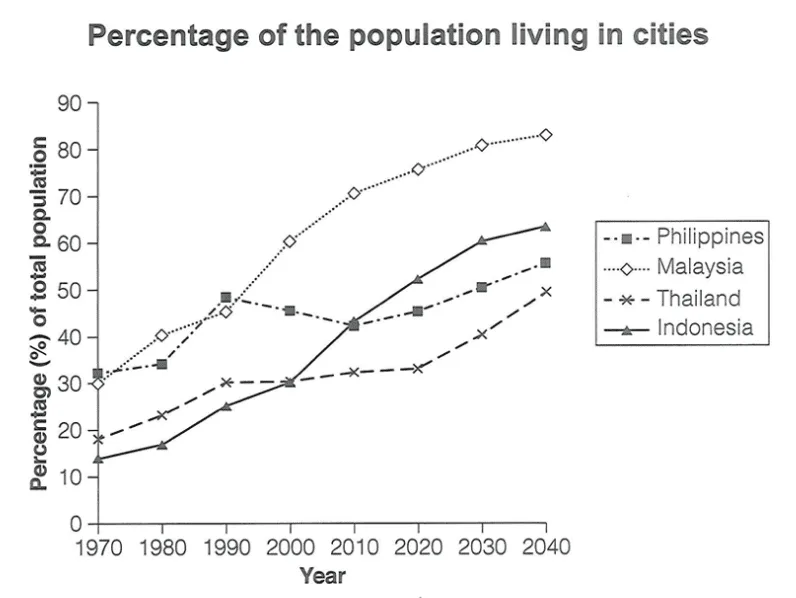
Urban Population Percentage in Four Asian Countries 1970-2040

The graph below gives information about the percentage of the population in four Asian countries living in cities from 1970 to 2020, with predictions for 2030 and 2040. Summarise the information by selecting and reporting the main features, and make comparisons where relevant.

Cambridge IELTS 18 Academic Test 1 Writing Task 1 visual

Annotated response

10 correction notes

Showing 10 correction notes.

The chart gives information about the urbanisation rates in four nations in Asia over five decades starting from 1970, with future projections for 2030 and 2040.

From a general perspective, all four countries have experienced a rise in over time, and this upward trend is expected to persist. Also, it is notable that Malaysia has witnessed the largest proportion of people residing in urban areas during most of the period shown .

A closer the graph reveals that in 1970, Malaysia had approximately 30% of its population residing in urban areas, while Indonesia recorded the lowest figure, at just 13%. Over the following two decades, both nations witnessed sharp increases —Malaysia’s urban population rose significantly to and Indonesia’s climbed steadily to 30% by 1990. From 1990 to 2020, urbanisation in both countries accelerated further. Malaysia reached a high of 75%, whereas . According to forecasts, this growth will continue, with Malaysia projected to 82% by 2040, and Indonesia .

By comparison, the Philippines had the highest urban population in 1970, at 31%, compared to Thailand’s relatively low figure of 19%. Between 1970 and 1990, the Philippines experienced a , while Thailand increased at a slower pace to 30%. However, from 1990 to 2010, the Philippines saw a slight dip , dropping to a , while Thailand’s urban population remained relatively flat . In the future, both countries are predicted to recover and grow steadily, with the Philippines and Thailand by 2040.

Overall assessment

Why this response received Band 7.0

The response demonstrates strong organisation and flexible language, covering all four countries with a clear overview, sustained comparisons, and mostly plausible data. The main limitation is a series of imprecise or misattributed figures, such as Indonesia's 1990 level and Malaysia's 2020 peak, alongside minor clashes between the overview and detailed reporting.

IELTS criteria

How each score was decided

Task Achievement

7.0

The response covers all four countries, gives a clear overview of rising and projected urbanisation, and makes relevant comparisons, but several figures are imprecise or misattributed relative to the chart, such as Indonesia reaching 30% by 1990 and Malaysia peaking at 75% in 2020.

Coherence and Cohesion

7.0

Ideas are logically organised into paired country paragraphs with a clear progression and effective use of cohesive devices, though transitions like 'By comparison' and 'A closer examination at the graph' are at times slightly mechanical or awkward.

Lexical Resource

7.0

Vocabulary is flexible and precise for describing trends, including 'urbanisation rates', 'witnessed a sharp increase', and 'hit a peak', with only occasional awkward collocations such as 'a closer examination at the graph'.

Grammatical Range and Accuracy

7.5

A wide range of structures is used with strong control, including varied complex sentences, passive forms, and accurate tense choices for historical data and predictions, with only rare minor errors.