Little Chalfont Library Membership and Loans

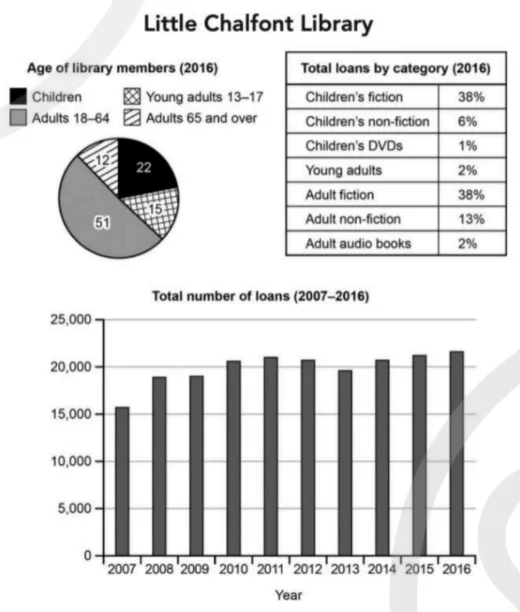
The charts below give information about a public library in a town called Little Chalfont. Summarise the information by selecting and reporting the main features, and make comparisons where relevant.

Cambridge IELTS 20 Academic Test 3 Writing Task 1 visual

Annotated response

9 correction notes

Showing 9 correction notes.

The pie chart provides information about the age distribution of members of the Little Chalfont public library in 2016, and the table illustrates the proportion of loans by category in the same year, while the bar chart shows the total number of items borrowed from 2007 to 2016.

Overall, adults aged 18 to 64 made up the of library users, and children’s and adult fiction were the most borrowed categories. In addition, the total number of loans generally increased over the ten-year period.

In terms of membership, in 2016, adults aged 18–64 accounted for just over half of all members (51%), making them the dominant age group. Children represented the second-largest segment at 22%, followed by young adults aged 13–17 at 15%. Seniors aged 65 and over constituted the smallest proportion, at only 12%. Regarding borrowing categories in 2016, fiction books for both children and adults were the most popular, each representing 38% of total loans. Non-fiction books were less frequently borrowed: adult non-fiction made up 13%, while children’s non-fiction accounted for only 6%. Other categories contributed minimally, with and adult audiobooks each at 2%, and children’s DVDs at just 1%.

Furthermore, the bar chart shows that the figure rose from in 2007 to roughly 19,000 in 2008 and remained relatively stable until 2010. It then before fluctuating slightly in the following years. By 2016, to approximately 22,000, the highest point recorded.

Overall assessment

Why this response received Band 7.0

The response is a well-organised report that accurately covers all three visuals, with a clear overview and precise data selection. Its main limitation is a fairly mechanical treatment of the bar chart in later years, where some trends are described somewhat loosely rather than with fully specific comparisons.

IELTS criteria

How each score was decided

Task Achievement

7.0

The response covers all three visuals with an accurate overview of the dominant age group, leading borrowing categories, and the rising loan trend, and the reported figures match the prompt, though the bar chart treatment after 2011 is somewhat general.

Coherence and Cohesion

7.0

Ideas are logically organised into clear paragraphing with a range of cohesive devices such as 'Overall', 'In terms of', and 'Regarding', and progression is consistently clear throughout.

Lexical Resource

7.0

There is a good range of vocabulary for describing proportions and trends, including 'constituted', 'dominant segment', 'fluctuating', and 'climbed', used with flexibility and only minor imprecision.

Grammatical Range and Accuracy

7.0

A variety of complex structures and accurate tense control are evident across the response, with errors rare and non-impeding.