UAE Health, Education and Life Expectancy

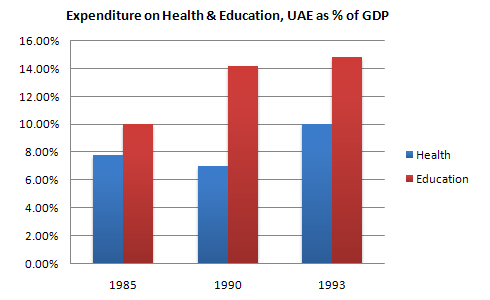
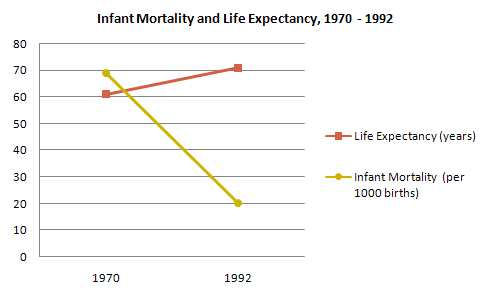
The graphs below show the Expenditure on Health & Education, UAE as percentages of GDP and Infant mortality and life expectancy.
Line graph 1 of 2 for an IELTS Academic Task 1 question about Expenditure on Health Education Uae.
Task visual 1 of 2.
Read an accessible description

Line graph 1 of 2 for an IELTS Academic Task 1 question about Expenditure on Health Education Uae.

Line graph 2 of 2 for an IELTS Academic Task 1 question about Infant Mortality and Life Expectancy Uae.
Task visual 2 of 2.
Read an accessible description

Line graph 2 of 2 for an IELTS Academic Task 1 question about Infant Mortality and Life Expectancy Uae.

Write this question

Write, submit, improve.

The current question is preloaded. Your draft is saved locally while scoring integration is being prepared.

High-fidelity exam simulation IELTS scoring criteria Detailed correction examples
IELTS band boosterWrite · Score · Improve
Part 1

You should spend about 20 minutes on this task. Write at least 150 words.

The graphs below show the Expenditure on Health & Education, UAE as percentages of GDP and Infant mortality and life expectancy.

Line graph 1 of 2 for an IELTS Academic Task 1 question about Expenditure on Health Education Uae.
Line graph 2 of 2 for an IELTS Academic Task 1 question about Infant Mortality and Life Expectancy Uae.
Words: 020:00 starts on first word

Marked essay library

Compare responses from Band 6.5.

Predicted band6.5The bar graph illustrates the expenditure on health and education sectors in the UAE, measured as the percentage of GDP, in three different years- 1985, 1990 and 1994 while the line graph demonstrates child mortality and life expectancy from 1970 to 1992. According to the diagram, investment in both health and education in the UAE grew over the time and infant mortality and life expectancy scenario improved. As is presented, expense on public health in 1985 was nearly 8% of the GDP in the UAE, whereas it slightly decreased half a decade later. In 1993, however, the healthcare expense made up 10% of the total GDP. Education expenditure rose constantly from 1985 to 1993 and UAE’s expenditure in education was higher than that of healthcare. In 1985, one-tenth GDP went on the education sector and it grew as high as 15% after 8 years. The line graph shows the infant mortality rates and citizens’ life expectancy between 1970 and 1992. It is evident that child death rate noticeably declined during the period from 70 deaths per thousand in 1970 to 20 per thousand is a great improvement indeed. Consequently, people’s life expectancy rose from 60 years to 70 years in just 22 years.
Task achievement7.0
Coherence & cohesion6.0
Lexical resource6.5
Grammar6.5
Predicted band6.5The bar graph indicates the expenditure ratio of the UAE government in education and healthcare between 1985 and 1993, whereas the line graph compares life expectancy and infant mortality rate in the UAE in 1970 with that of 1992. Overall, UAE administrator spent more ratio of their budget on education than they did on health care. The improvement Emiratis achieved to prevent child death cases was remarkable. As the bar chart suggests, the UAE administration spent one-tenth of their GDP in the health sector in 1985 and their spending on public health was roughly 2% lower than that. After 5 years, 14% of GDP went on education which was almost double than the expenditure in health division. Interestingly, the UAE authority spent less ratio of their GDP in public health in 1990 than they did in 1985 but it went up to 10% in 1993. The funds for education went as high as nearly 15% in 1993. The line graph delineates that Emiratis people’s life expectancy was 60 years in 1970 and it was extended to just over 70 years after two decades. Infant mortality rate, on the other hand, was quite high in 1970 (70 child death in every thousand) and it improved significantly during 22 years when it went as low as 20 per thousand.
Task achievement7.0
Coherence & cohesion6.5
Lexical resource6.0
Grammar6.5
Predicted band6.5The bar graph compares the UAE government’s expenditures on health and education sectors in three different years with a 5 years gap while the line graph shows the infant mortality rate and citizens' life expectancy from 1970 to 1992. As is evident, the UAE government spent more on healthcare and education in 1990 than they did in the past while citizens’ life expectancy enhanced along with declining the infant mortality rate. As is given in the diagrams, the UAE government spent less than 8% of their GDP on healthcare in 1985 and just 10% on education. After 5 years, the spending on healthcare decreased slightly but increased dramatically in the education sector. In the final year, both sectors got priority and the spending on health sector increased to 10% while it was about 15% of the GDP in education. The line graph represents that the percentage of spending in the UAE had a direct impact on their citizens’ life expectancy and infant's mortality rate. While the life expectancy in the UAE was just 60 years in 1970, it increased to over 70 in 1992. On the other hand, the infant mortality rate decreased to just 20% in 1992 from the astonishing 70% in 1970.
Task achievement6.5
Coherence & cohesion6.0
Lexical resource6.5
Grammar6.5