The pie charts below show the average household expenditures in a country in 1950 and 2010.
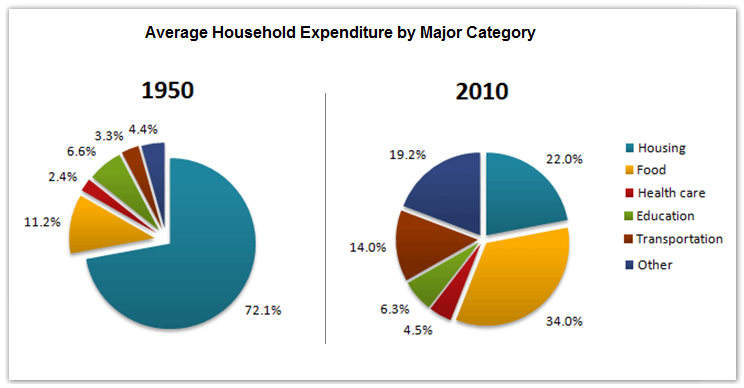
The pie charts below show the average household expenditures in a country in 1950 and 2010.
Pie chart for an IELTS Academic Task 1 question about Household Expenditure in 1950 and 2010.
Write this question
The current question is preloaded. Your draft is saved locally while scoring integration is being prepared.
You should spend about 20 minutes on this task. Write at least 150 words.
The pie charts below show the average household expenditures in a country in 1950 and 2010.
Marked essay library
Related questions
The pie chart gives information on UAE government spending in 2000. The total budget was AED 315 billion.
3 marked essaysBand 6.0–6.5Pie chartThe pie charts below show information on the highest level of education of women in Someland in 1945 and 1995.
3 marked essaysBand 6.5–7.0